

 PDF下载 ( 2546 KB)

二维剪切波弹性成像联合血清学指标对原发性胆汁性胆管炎与重叠综合征的鉴别诊断价值
DOI: 10.12449/JCH260816
Value of two-dimensional shear wave elastography combined with serological markers in the differential diagnosis of primary biliary cholangitis and overlap syndrome
-
摘要:
目的 二维剪切波弹性成像(2D-SWE)联合血清学指标构建机器学习模型,探讨其鉴别原发性胆汁性胆管炎(PBC)与重叠综合征(OS)的临床价值。 方法 回顾性纳入2021年1月—2025年12月于南通市第三人民医院经病理证实的199例PBC或OS患者为研究对象,其中PBC组125例、OS组74例。按7∶3的比例随机分为训练集(n=139)与测试集(n=60)。收集血清学指标、常规二维超声及2D-SWE参数[剪切波速度(VS)、肝纤维化指数(LFI)等]。符合正态分布的计量资料两组间比较采用成组t检验;非正态分布的计量资料两组间比较采用Mann-Whitney U检验。计数资料两组间比较采用χ2检验。通过单因素和多因素Logistic回归筛选独立预测因子,将筛选出的变量纳入6种机器学习模型,通过5折交叉验证优化参数,在测试集中比较受试者操作特征曲线下面积(AUC)等指标确定最优模型,使用沙普利加性解释(SHAP)法分析评价模型。 结果 两组患者均以女性为主(OS组87.8%,PBC组79.2%)。OS组患者的年龄、VS、LFI、脾脏面积、天冬氨酸氨基转移酶、总胆红素、凝血酶原时间、免疫球蛋白(Ig)G及IgM水平均显著高于PBC组(Z值分别为-2.883、-6.524、-4.000、-3.061、-2.194、-2.372、-4.079、-6.964、-2.709,P值均<0.05),血小板计数低于PBC组(Z=4.098,P<0.001);抗核抗体比例、肝纤维化分期及炎症分级在两组间差异均有统计学意义(χ2值分别为3.458、63.198、101.038,P值均<0.05)。将不存在多重共线性的变量纳入回归分析,多因素Logistic回归分析显示,VS[比值比(OR)=4.503,95%置信区间(CI):1.698~11.943,P=0.003]、LFI(OR=1.813,95%CI:1.050~3.132,P=0.033)、IgG(OR=1.121,95%CI:1.026~1.226,P=0.012)是区分PBC与OS的独立预测因子。基于上述变量构建6种机器学习模型,其中逻辑回归模型在测试集中的预测效能最佳,AUC为0.881(95%CI:0.788~0.974),敏感度为0.731,特异度为0.794。SHAP分析显示,IgG对模型预测贡献度最大。 结论 联合2D-SWE参数(VS、LFI)与IgG构建的无创多模态机器学习模型可有效鉴别PBC与OS,为临床决策是否进一步行肝脏活组织检查提供参考依据。 Abstract:Objective To construct a machine learning model combining two-dimensional shear wave elastography (2D-SWE) and serological markers, and to investigate its clinical value in differentiating primary biliary cholangitis (PBC) from overlap syndrome (OS). Methods A total of 199 patients with pathologically confirmed PBC or OS in Nantong Third People’s Hospital from January 2021 to December 2025 were retrospectively enrolled, with 125 patients in the PBC group and 74 in the OS group. The patients were randomly divided into a training set with 139 patients and a test set with 60 patients at a ratio of 7∶3. Related data were collected, including serological markers, conventional two-dimensional ultrasound parameters, and 2D-SWE parameters (including velocity of shear wave [VS] and liver fibrosis index [LFI]). The independent-samples t test was used for comparison of normally distributed continuous data between two groups, and the Mann-Whitney U test was used for comparison of non-normally distributed continuous data between two groups; the chi-square test was used for comparison of categorical data between two groups. The univariate and multivariate Logistic regression analyses were used to identify independent predictive factors, which were then incorporated into six machine learning models, and 5-fold cross-validation was used for optimization of parameters. The indicators including the area under the receiver operating characteristic curve (AUC) were compared in the test set to determine the best model, and the SHapley additive exPlanations (SHAP) analysis was used for model interpretation. Results Female patients accounted for 87.8% in the OS group and 79.2% in the PBC group. Compared with the PBC group, the OS group had significantly higher age, VS, LFI, splenic area, aspartate aminotransferase, total bilirubin, prothrombin time, immunoglobulin G (IgG), and immunoglobulin M (Z=-2.883, -6.524, -4.000, -3.061, -2.194, -2.372, -4.079, -6.964, and -2.709, all P<0.05) and a significantly lower platelet count (Z=4.098, P<0.001), and there were also significant differences between the two groups in the proportion of patients with positive anti-nuclear antibody, fibrosis stage, and inflammation grade (χ2=3.458, 63.198, and 101.038, all P<0.05). Variables without multicollinearity were included in the regression analysis, and the multivariate Logistic regression analysis showed that VS (odds ratio [OR]=4.503, 95% confidence interval [CI]: 1.698 — 11.943, P=0.003), LFI (OR=1.813, 95%CI: 1.050 — 3.132, P=0.033), and IgG (OR=1.121, 95%CI: 1.026 — 1.226, P=0.012) were independent predictive factors for differentiating PBC from OS. Six machine learning models were constructed based on these variables, among which the logistic regression model showed the best predictive performance in the test set, with an AUC of 0.881 (95%CI: 0.788 — 0.974), a sensitivity of 0.731, and a specificity of 0.794. The SHAP analysis showed that IgG contributed the most to model prediction. Conclusion The noninvasive multimodal machine learning model combining 2D-SWE parameters (VS, LFI) and serum IgG can effectively differentiate PBC from OS, providing a reference for clinical decision-making regarding the need for liver biopsy. -
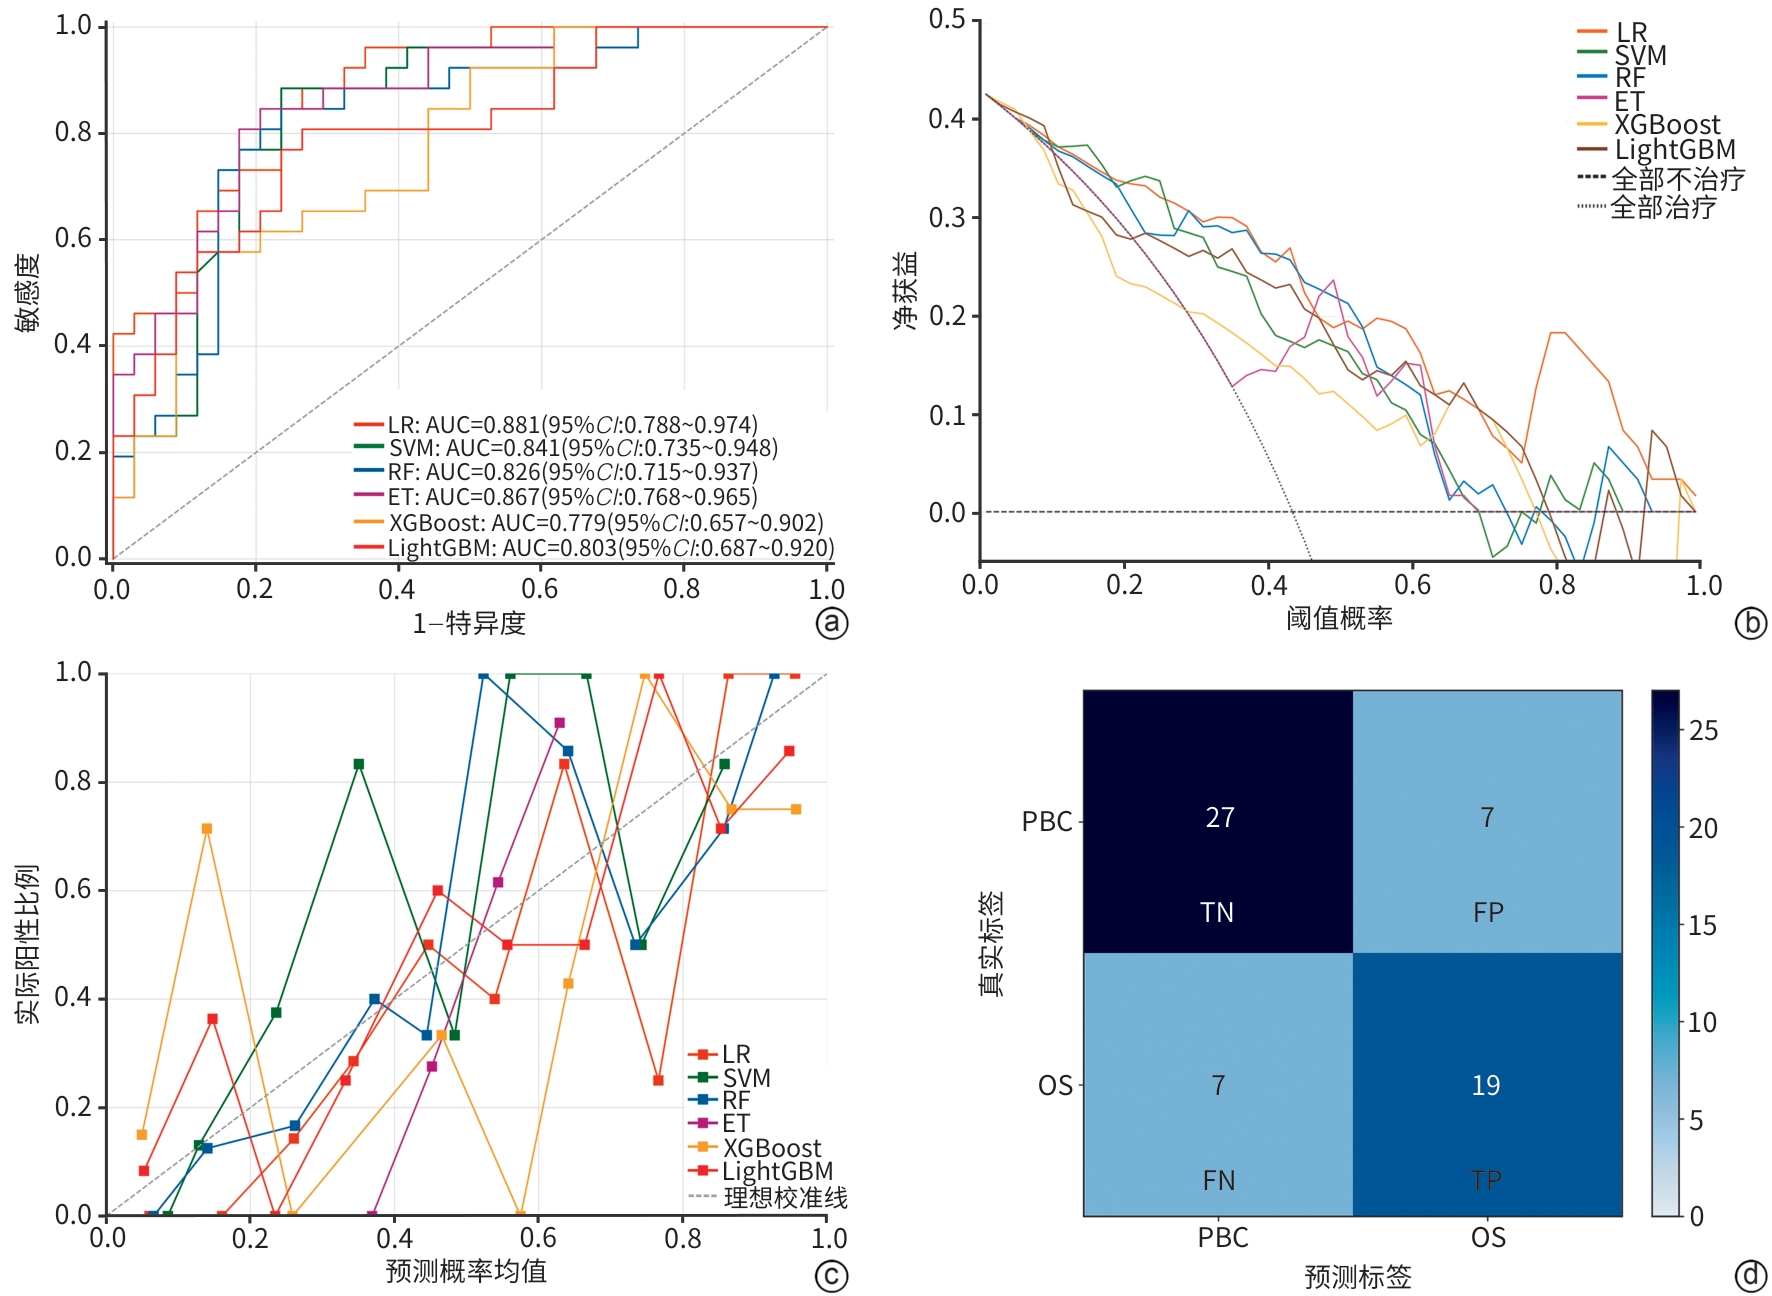
注: a,测试集的ROC曲线;b,测试集的决策曲线分析;c,测试集的校准曲线;d,LR模型测试集的混淆矩阵。LR,逻辑回归;SVM,支持向量机;RF,随机森林;ET,额外树;XGBoost,极端梯度提升;LightGBM,轻量梯度提升机;TN,真阴性;FP,假阳性;FN,假阴性;TP,真阳性;PBC,原发性胆汁性胆管炎;OS,重叠综合征;ROC,受试者操作特征曲线;AUC,ROC曲线下面积;CI,置信区间。
图 1 测试集中LR模型与其他算法区分PBC和OS的性能比较
Figure 1. Performance comparison between LR model and other algorithms in distinguishing PBC and OS in the test set
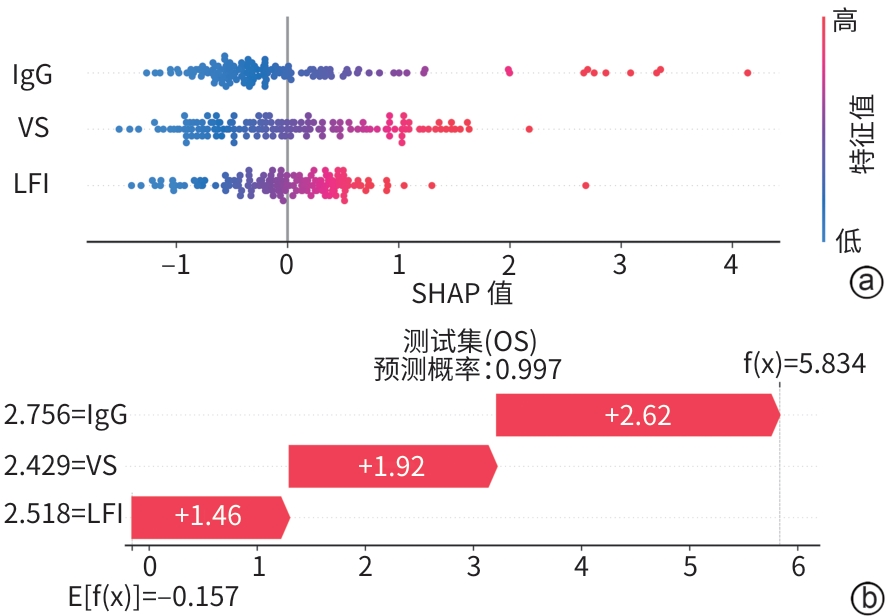
注: a,SHAP摘要图;b,测试集中1例患者的预测过程。IgG,免疫球蛋白G;VS,剪切波速度;LFI,肝纤维化指数;OS,重叠综合征;LR,逻辑回归;SHAP,沙普利加性解释。
图 2 LR模型的SHAP特征分析
Figure 2. SHAP feature analysis of the LR model
表 1 PBC组与OS组患者临床特征比较
Table 1. Comparison of clinical characteristics between the PBC group and OS group
变量 PBC组(n=125) OS组(n=74) 统计值 P值 年龄(岁) 54.00(22.00~74.00) 58.00(26.00~75.00) Z=-2.883 0.004 性别[例(%)] χ2=1.834 0.177 男 26(20.8) 9(12.2) 女 99(79.2) 65(87.8) 体重指数(kg/m2) 22.72(15.40~43.25) 22.17(16.94~27.97) Z=1.568 0.117 VS(m/s) 1.72(0.96~3.28) 2.25(1.07~3.12) Z=-6.524 <0.001 ATT(dB·cm-1·MHz-1) 0.54(0.33~0.91) 0.53(0.31~0.72) Z=1.287 0.198 LFI 3.01(0.54~5.06) 3.61(1.02~8.07) Z=-4.000 <0.001 脾脏面积(mm2) 2 507.28(1 226.40~10 267.20) 2 939.87(1 402.20~8 437.63) Z=-3.061 0.002 门静脉内径(mm) 11.44±1.34 11.61±1.37 t=-0.846 0.399 ALT(U/L) 90.00(4.00~4 079.00) 98.00(12.00~982.00) Z=-0.960 0.338 AST(U/L) 72.00(17.00~2 733.00) 96.00(25.00~1 094.00) Z=-2.194 0.028 TBil(μmol/L) 17.60(6.10~214.10) 21.85(8.20~165.30) Z=-2.372 0.018 GGT(U/L) 224.00(11.00~3 393.00) 206.50(19.00~1 654.00) Z=0.313 0.755 ALP(U/L) 184.00(33.00~1 549.00) 174.50(67.00~824.00) Z=0.065 0.949 凝血酶原时间(s) 11.40(9.00~15.60) 12.30(1.05~17.80) Z=-4.079 <0.001 血小板计数(×109/L) 177.00(33.00~423.00) 138.50(46.00~338.00) Z=4.098 <0.001 IgG(g/L) 14.30(7.66~42.30) 20.45(7.00~53.20) Z=-6.964 <0.001 IgM(g/L) 2.10(0.35~13.00) 3.24(0.42~12.30) Z=-2.709 0.007 抗核抗体[例(%)] χ2=3.458 0.046 阳性 99(79.2) 49(66.2) 阴性 26(20.8) 25(33.8) 抗线粒体抗体2型[例(%)] χ2=0.283 0.547 阳性 50(40.0) 26(35.1) 阴性 75(60.0) 48(64.9) 肝纤维化分期[例(%)] χ2=63.198 <0.001 0~1期 60(48.0) 2(2.7) 2期 33(26.4) 14(18.9) 3期 24(19.2) 33(44.6) 4期 8(6.4) 25(33.8) 炎症分级[例(%)] χ2=101.038 <0.001 0~1级 28(22.4) 0(0.0) 2级 72(57.6) 5(6.8) 3级 25(20.0) 67(90.5) 4级 0(0.0) 2(2.7) 注:PBC,原发性胆汁性胆管炎;OS,重叠综合征;VS,剪切波速度;ATT,声衰减系数;LFI,肝纤维化指数;ALT,丙氨酸氨基转移酶;AST,天冬氨酸氨基转移酶;TBil,总胆红素;GGT,γ-谷氨酰转移酶;ALP,碱性磷酸酶;IgG,免疫球蛋白G;IgM,免疫球蛋白M。
 下载: 导出CSV
表 2 OS相关因素的单因素与多因素Logistic回归分析
Table 2. Univariate and multivariate Logistic regression analysis of factors associated with overlap syndrome
变量 单因素Logistic回归分析 多因素Logistic回归分析 OR(95%CI) P值 OR(95%CI) P值 体重指数 0.858(0.755~0.974) 0.018 VS 8.347(3.515~19.823) <0.001 4.503(1.698~11.943) 0.003 LFI 1.856(1.248~2.759) 0.002 1.813(1.050~3.132) 0.033 脾脏面积 1.000(1.000~1.001) 0.016 凝血酶原时间 1.313(1.020~1.689) 0.034 血小板计数 0.991(0.986~0.997) 0.004 IgG 1.183(1.092~1.281) <0.001 1.121(1.026~1.226) 0.012 IgM 1.223(1.051~1.424) 0.010 注:OS,重叠综合征;OR,比值比;CI,置信区间;VS,剪切波速度;LFI,肝纤维化指数;IgG,免疫球蛋白G;IgM,免疫球蛋白M。
下载: 导出CSV
表 3 训练集与测试集中6种机器学习模型的预测能力评估
Table 3. Evaluation of predictive performance of six machine learning models across training and test sets
模型 集别 AUC 95%CI CV_AUC 准确度 精准度 敏感度 特异度 F1值 LR 训练集 0.844 0.769~0.919 0.854 0.763 0.632 0.750 0.769 0.686 测试集 0.881 0.788~0.974 0.767 0.731 0.731 0.794 0.731 SVM 训练集 0.874 0.806~0.942 0.824 0.849 0.776 0.792 0.879 0.784 测试集 0.841 0.735~0.948 0.717 0.714 0.577 0.824 0.638 RF 训练集 0.934 0.883~0.985 0.824 0.849 0.765 0.812 0.868 0.788 测试集 0.826 0.715~0.937 0.800 0.792 0.731 0.853 0.760 ET 训练集 0.866 0.795~0.936 0.851 0.835 0.745 0.792 0.857 0.768 测试集 0.867 0.768~0.965 0.767 0.750 0.692 0.824 0.720 XGBoost 训练集 0.992 0.974~1.000 0.798 0.957 0.920 0.958 0.956 0.939 测试集 0.779 0.657~0.902 0.683 0.640 0.615 0.735 0.627 LightGBM 训练集 0.949 0.904~0.994 0.797 0.885 0.833 0.833 0.912 0.833 测试集 0.803 0.687~0.920 0.733 0.708 0.654 0.794 0.680 注:LR,逻辑回归;SVM,支持向量机;RF,随机森林;ET,额外树;XGBoost,极端梯度提升;LightGBM,轻量梯度提升机;AUC,受试者操作特征曲线下面积;CI,置信区间;CV_AUC,训练集5折交叉验证的AUC均值。
下载: 导出CSV
-
[1] European Association for the Study of the Liver. EASL Clinical Practice Guidelines: The diagnosis and management of patients with primary biliary cholangitis[J]. J Hepatol, 2017, 67( 1): 145- 172. DOI: 10.1016/j.jhep.2017.03.022. [2] European Association for the Study of the Liver. EASL Clinical Practice Guidelines on the management of autoimmune hepatitis[J]. J Hepatol, 2025, 83( 2): 453- 501. DOI: 10.1016/j.jhep.2025.03.017. [3] Efe C, Ozaslan E, Heurgué-Berlot A, et al. Sequential presentation of primary biliary cirrhosis and autoimmune hepatitis[J]. Eur J Gastroenterol Hepatol, 2014, 26( 5): 532- 537. DOI: 10.1097/MEG.0000000000000075. [4] Yang F, Wang Q X, Wang Z Y, et al. The natural history and prognosis of primary biliary cirrhosis with clinical features of autoimmune hepatitis[J]. Clin Rev Allergy Immunol, 2016, 50( 1): 114- 123. DOI: 10.1007/s12016-015-8516-5. [5] Park Y, Cho Y, Cho E J, et al. Retrospective analysis of autoimmune hepatitis-primary biliary cirrhosis overlap syndrome in Korea: Characteristics, treatments, and outcomes[J]. Clin Mol Hepatol, 2015, 21( 2): 150- 157. DOI: 10.3350/cmh.2015.21.2.150. [6] European Association for the Study of the Liver. EASL Clinical Practice Guidelines on non-invasive tests for evaluation of liver disease severity and prognosis-2021 update[J]. J Hepatol, 2021, 75( 3): 659- 689. DOI: 10.1016/j.jhep.2021.05.025. [7] Ferraioli G, Barr R G, Berzigotti A, et al. WFUMB guidelines/guidance on liver multiparametric ultrasound. Part 2: Guidance on liver fat quantification[J]. Ultrasound Med Biol, 2024, 50( 8): 1088- 1098. DOI: 10.1016/j.ultrasmedbio.2024.03.014. [8] Asif S, Yi W H, ur-Rehman S, et al. Advancements and prospects of machine learning in medical diagnostics: Unveiling the future of diagnostic precision[J]. Arch Comput Meth Eng, 2025, 32( 2): 853- 883. DOI: 10.1007/s11831-024-10148-w. [9] Wang W, Zhang J C, Tian W S, et al. Shear wave elastography-based ultrasomics: Differentiating malignant from benign focal liver lesions[J]. Abdom Radiol(NY), 2021, 46( 1): 237- 248. DOI: 10.1007/s00261-020-02614-3. [10] Dong B T, He R L, Ju S H, et al. Fibrosis-4plus score: A novel machine learning-based tool for screening high-risk varices in compensated cirrhosis(CHESS2004): An international multicenter study[J]. Clin Mol Hepatol, 2025, 31( 3): 881- 898. DOI: 10.3350/cmh.2024.0898. [11] Chinese Society of Ultrasound in Medicine; Oncology Intervention Committee of Chinese Research Hospital Society; National Health Commission Capacity Building and Continuing Education Expert Committee on Ultrasonic Diagnosis. Guideline for ultrasonic diagnosis of liver diseases[J]. J Clin Hepatol, 2021, 37( 8): 1770- 1785. DOI: 10.3969/j.issn.1001-5256.2021.08.007.中华医学会超声医学分会, 中国研究型医院学会肿瘤介入专业委员会, 国家卫生健康委员会能力建设和继续教育中心超声医学专家委员会. 肝病超声诊断指南[J]. 临床肝胆病杂志, 2021, 37( 8): 1770- 1785. DOI: 10.3969/j.issn.1001-5256.2021.08.007. [12] Koga T, Morikawa Y. Ultrasonographic determination of the splenic size and its clinical usefulness in various liver diseases[J]. Radiology, 1975, 115( 1): 157- 161. DOI: 10.1148/115.1.157. [13] Scheuer P J. Classification of chronic viral hepatitis: A need for reassessment[J]. J Hepatol, 1991, 13( 3): 372- 374. DOI: 10.1016/0168-8278(91)90084-o. [14] Yan Y L, Xing X, Wang Y, et al. Clinical utility of two-dimensional shear-wave elastography in monitoring disease course in autoimmune hepatitis-primary biliary cholangitis overlap syndrome[J]. World J Gastroenterol, 2022, 28( 18): 2021- 2033. DOI: 10.3748/wjg.v28.i18.2021. [15] Muratori P, Granito A, Pappas G, et al. The serological profile of the autoimmune hepatitis/primary biliary cirrhosis overlap syndrome[J]. Am J Gastroenterol, 2009, 104( 6): 1420- 1425. DOI: 10.1038/ajg.2009.126. [16] Schulz L, Sebode M, Weidemann S A, et al. Variant syndromes of primary biliary cholangitis[J]. Best Pract Res Clin Gastroenterol, 2018, 34: 55- 61. DOI: 10.1016/j.bpg.2018.06.003. [17] Liang Y X, Khandakar B, Hao Y S, et al. Histology and clinical correlations in autoimmune hepatitis, primary biliary cholangitis, and autoimmune hepatitis-primary biliary cholangitis overlap syndrome[J]. Ann Diagn Pathol, 2023, 67: 152178. DOI: 10.1016/j.anndiagpath.2023.152178. [18] Yan Y L, Xing X, Lu Q, et al. Assessment of biopsy proven liver fibrosis by two-dimensional shear wave elastography in patients with primary biliary cholangitis[J]. Dig Liver Dis, 2020, 52( 5): 555- 560. DOI: 10.1016/j.dld.2020.02.002. [19] Chen Rui, Zheng Yijun, Gao Zhiling, et al. Value of ultrasound combined with elastography in evaluating inflammation grading in patients with chronic liver disease at S2 stage of liver fibrosis[J]. Acad J Nav Med Univ, 2025, 46( 7): 863- 868. DOI: 10.16781/j.CN31-2187/R.20240558.陈蕊, 郑一君, 高志玲, 等. 超声联合弹性成像技术评估慢性肝病肝纤维化S2期患者炎症分级的价值[J]. 海军军医大学学报, 2025, 46( 7): 863- 868. DOI: 10.16781/j.CN31-2187/R.20240558. [20] Wang Y, Li Y N, Wang X Y, et al. Predicting liver disease risk using a combination of common clinical markers: A screening model from routine health check-up[J]. Dis Markers, 2020, 2020: 8460883. DOI: 10.1155/2020/8460883. [21] Wang K L, Li Y, Pan J F, et al. Noninvasive diagnosis of AIH/PBC overlap syndrome based on prediction models[J]. Open Med(Wars), 2022, 17( 1): 1550- 1558. DOI: 10.1515/med-2022-0526. -

 本文二维码
本文二维码
计量
- 文章访问数: 13
- HTML全文浏览量: 2
- PDF下载量: 1
- 被引次数: 0


