

 PDF下载 ( 1318 KB)

甘油三酯葡萄糖-体重指数与新发代谢相关脂肪性肝病的关联性分析
DOI: 10.12449/JCH260412
Association between triglyceride glucose-body mass index and new-onset metabolic dysfunction-associated fatty liver disease
-
摘要:
目的 探讨血清空腹甘油三酯葡萄糖-体重指数(TyG-BMI)轨迹与10年内新发代谢相关脂肪性肝病(MAFLD)的关联性。 方法 回顾性收集2013、2018和2023年于西南医科大学附属中医医院体检且2013年未患MAFLD的体检者数据,根据纳入与排除标准,纳入有效研究对象1 340例。采用R 4.3.0软件中gbmt包构建TyG-BMI动态变化轨迹模型,确定4个不同的TyG-BMI轨迹组:低水平组(n=352)、中水平组(n=517)、高水平组(n=314)和极高水平组(n=157)。收集研究对象一般资料及血液生化指标检查结果,并进行组间比较。计数资料组间比较采用χ2检验;不符合正态分布且方差不齐的计量资料多组间比较采用Kruskal-Wallis H秩和检验。采用Cox回归分析不同TyG-BMI轨迹组与MAFLD发生风险之间的关系,并使用受试者操作特征曲线(ROC曲线)评估TyG-BMI对MAFLD的诊断价值。 结果 MAFLD的累积发病率随TyG-BMI轨迹水平的升高而增加,低、中、高和极高水平组的MAFLD累积发病率分别为4.83%、29.98%、61.15%和83.44%,且男性高于女性(51.34% vs 20.67%),差异均有统计学意义(P值均<0.001)。多因素Cox回归分析显示,TyG-BMI轨迹水平、尿酸、舒张压、血红蛋白和丙氨酸氨基转移酶增高均是MAFLD发病的独立危险因素(P值均<0.05),高密度脂蛋白胆固醇增高是MAFLD的独立保护因素(P<0.001)。校正混杂因素后,中水平组、高水平组和极高水平组的风险比分别为4.430[95%置信区间(CI):2.660~7.377,P<0.001]、6.937(95%CI:4.110~11.708,P<0.001)和7.989(95%CI:4.616~13.827,P<0.001)。ROC曲线分析结果显示,TyG-BMI的诊断价值最高,ROC曲线下面积值为0.859(95%CI:0.840~0.879),敏感度为79.8%,特异度为76.3%。 结论 MAFLD的发病风险随着TyG-BMI轨迹水平的升高而增加,TyG-BMI可作为MAFLD的预测指标。 -
关键词:
- 代谢相关脂肪性肝病 /
- 甘油三酯葡萄糖-体重指数 /
- 危险因素
Abstract:Objective To investigate the association between serum fasting triglyceride glucose-body mass index (TyG-BMI) and new-onset metabolic dysfunction-associated fatty liver disease (MAFLD) within 10 years. Methods A retrospective analysis was performed for the data of individuals who underwent physical examination in The Affiliated Traditional Chinese Medicine Hospital of Southwest Medical University in 2013, 2018, and 2023 and were not diagnosed with MAFLD in 2013, and a total of 1 340 valid subjects were enrolled according to the inclusion and exclusion criteria. The gbmt package in R 4.3.0 was used to construct the dynamic change trajectory model of TyG-BMI, and four different TyG-BMI trajectory groups were determined, i.e., the low-level group (n=352), the medium-level group (n=517), the high-level group (n=314), and the extremely high-level group (n=157). The data on general information and blood biochemical parameters were collected from all subjects and were then compared between groups. The chi-square test was used for comparison of categorical data between groups, and the Kruskal-Wallis H test was used for comparison of non-normally distributed continuous data with heterogeneity of variance between multiple groups. The Cox regression analysis was used to investigate the association between different TyG-BMI trajectories and the risk of MAFLD, and the receiver operating characteristic (ROC) curve was used to assess the value of TyG-BMI in the diagnosis of MAFLD. Results The cumulative incidence rate of MAFLD increased with the increase in the level of TyG-BMI trajectory, with a cumulative incidence rate of 4.83% in the low-level group, 29.98% in the medium-level group, 61.15% in the high-level group, and 83.44% in the extremely high-level group (P<0.001), and the cumulative incidence rate of MAFLD in men was significantly higher than that in women (51.34% vs 20.67%, P<0.001). The multivariate Cox regression analysis showed that increases in the levels of TyG-BMI trajectory, uric acid, diastolic blood pressure, hemoglobin, and alanine aminotransferase were independent risk factors for the onset of MAFLD (all P<0.05), while the increase in high-density lipoprotein cholesterol was an independent protective factor against MAFLD (P<0.001). After adjustment for confounding factors, the medium-, high-, and extremely high-level groups had a hazard ratio of 4.430 (95% confidence interval [CI]: 2.660 — 7.377, P<0.001), 6.937 (95%CI: 4.110 — 11.708, P<0.001), and 7.989 (95%CI: 4.616 — 13.827, P<0.001), respectively. The ROC curve analysis showed that TyG-BMI had the highest diagnostic value, with an area under the ROC curve of 0.859 (95%CI: 0.840 — 0.879), a sensitivity of 79.8%, and a specificity of 76.3%. Conclusion The risk of MAFLD increases with the increase in the level of TyG-BMI trajectory, and TyG-BMI can be used as a predictive indicator for MAFLD. -
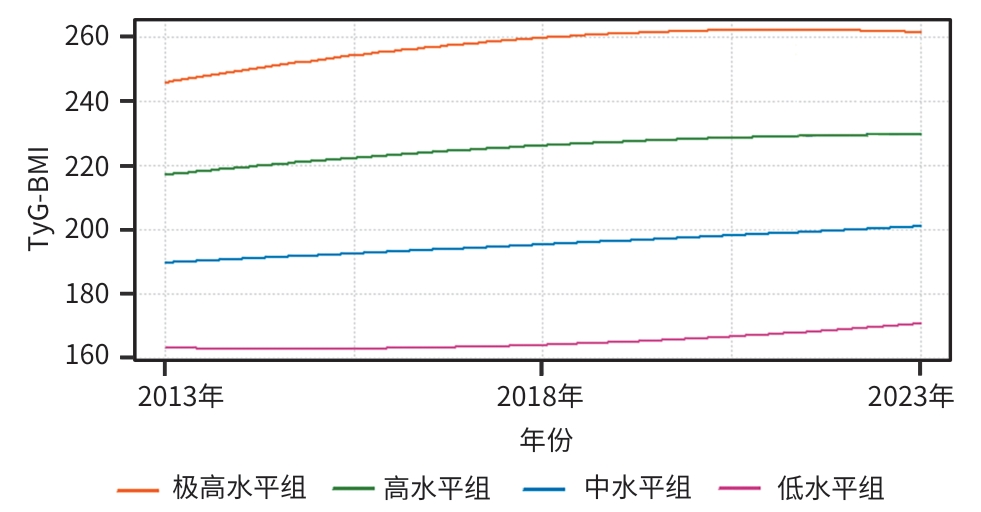
注: TyG-BMI,甘油三酯葡萄糖-体重指数。
图 1 体检者TyG-BMI轨迹分组
Figure 1. Trajectory subgrouping of TyG-BMI in the subjects under examination
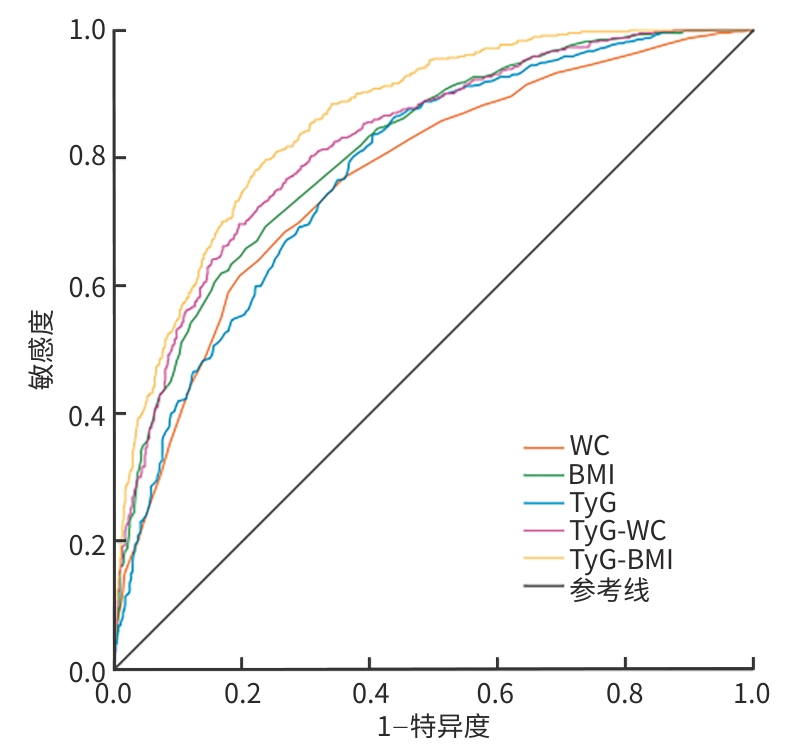
注: WC,腰围;BMI,体重指数;TyG,甘油三酯葡萄糖指数;TyG-BMI,甘油三酯葡萄糖-体重指数;MAFLD,代谢相关脂肪性肝病;ROC曲线,受试者操作特征曲线。
图 2 TyG-BMI及相关指标预测MAFLD的ROC曲线
Figure 2. ROC of TyG-BMI and related indicators for predicting MAFLD
表 1 不同TyG-BMI轨迹组发生MAFLD情况
Table 1. The occurrence of MAFLD in different TyG-BMI trajectory groups
MAFLD 低水平组 中水平组 高水平组 极高水平组 χ2值 P值 总计[例(%)] 436.986 <0.001 是 17(4.83) 155(29.98) 192(61.15) 131(83.44) 否 335(95.17) 362(70.02) 122(38.85) 26(16.56) 男[例(%)] 169.468 <0.001 是 7(8.43) 94(37.01) 154(63.11) 110(84.61) 否 76(91.57) 160(62.99) 90(36.89) 20(15.39) 女[例(%)] 145.495 <0.001 是 10(3.72) 61(23.19) 38(54.29) 21(77.78) 否 259(96.28) 202(76.81) 32(45.71) 6(22.22) 注:MAFLD,代谢相关脂肪性肝病;TyG-BMI,甘油三酯葡萄糖-体重指数。
 下载: 导出CSV
表 2 不同TyG-BMI轨迹组2013年基线情况对比
Table 2. Comparison of baseline data in 2013 among different TyG-BMI trajectory groups
指标 低水平组(n=352) 中水平组(n=517) 高水平组(n=314) 极高水平组(n=157) 统计值 P值 性别[例(%)] χ2=258.203 <0.001 男 83(23.58) 254(49.13) 244(77.71) 130(82.80) 女 269(76.42) 263(50.87) 70(22.29) 27(17.20) 年龄(岁) 30.00(26.00~40.00) 32.00(27.00~44.00) 39.00(29.00~49.00) 39.00(32.00~48.00) H=57.007 <0.001 白细胞计数(×109/L) 6.00(5.04~6.92) 6.32(5.40~7.00) 6.34(5.46~7.01) 6.61(6.12~7.48) H=36.296 <0.001 红细胞计数(×1012/L) 4.58(4.35~4.83) 4.83(4.49~5.15) 4.91(4.71~5.21) 4.99(4.80~5.25) H=125.739 <0.001 血红蛋白(g/L) 136(128~143) 144(133~154) 150(143~158) 151(144~160) H=196.473 <0.001 血小板计数(×109/L) 212(174~246) 212(174~245) 212(175~240) 212(183~253) H=1.163 0.762 尿酸(μmol/L) 249(208~302) 290(244~342) 347(299~398) 375(331~430) H=320.686 <0.001 尿素(mmol/L) 4.30(3.60~5.00) 4.58(3.70~5.40) 4.70(3.97~5.50) 4.70(3.80~5.49) H=25.571 <0.001 肌酐(μmol/L) 61.50(55.00~72.00) 69.00(58.00~82.00) 79.00(68.00~89.00) 82.00(73.00~92.00) H=178.901 <0.001 空腹血糖(mmol/L) 4.76(4.49~5.02) 4.91(4.60~5.21) 5.02(4.68~5.47) 5.20(4.75~5.61) H=84.547 <0.001 总蛋白(g/L) 73.30(70.20~76.30) 73.30(70.30~76.30) 73.20(70.00~75.70) 73.30(71.00~75.10) H=3.062 0.382 白蛋白(g/L) 46.08(44.53~47.48) 46.08(44.65~47.50) 46.08(44.50~47.80) 46.08(44.15~47.85) H=0.520 0.914 总胆红素(μmol/L) 13.20(9.60~16.40) 12.60(9.00~15.65) 13.40(9.27~16.63) 13.30(10.55~15.70) H=5.306 0.151 直接胆红素(μmol/L) 4.70(3.50~4.80) 4.70(3.30~5.80) 4.70(3.30~5.70) 4.80(3.50~5.60) H=1.606 0.658 AST(U/L) 18.00(15.00~23.00) 20.00(16.00~25.00) 22.00(18.00~27.00) 25.00(18.00~32.00) H=89.688 <0.001 ALT(U/L) 14.00(10.00~20.00) 18.00(13.00~28.00) 25.00(17.00~36.00) 33.00(22.00~55.00) H=230.692 <0.001 TG(mmol/L) 0.77(0.61~1.01) 1.14(0.85~1.51) 1.57(1.13~2.15) 2.31(1.50~3.30) H=486.587 <0.001 TC(mmol/L) 4.27(3.79~4.91) 4.63(4.06~5.21) 4.89(4.33~5.66) 5.10(4.50~5.96) H=112.169 <0.001 HDL-C(mmol/L) 1.66(1.50~1.94) 1.48(1.25~1.71) 1.33(1.14~1.54) 1.23(1.07~1.41) H=237.554 <0.001 LDL-C(mmol/L) 2.44(2.04~3.00) 2.95(2.39~3.40) 3.21(2.67~3.97) 3.39(3.00~4.11) H=193.156 <0.001 收缩压(mmHg) 116(106~123) 122(112~127) 126(118~135) 130(120~142) H=150.239 <0.001 舒张压(mmHg) 71(63~76) 75(67~79) 78(72~85) 80(74~88) H=143.131 <0.001 WC(cm) 70(67~78) 79(74~85) 91(86~94) 98(92~101) H=686.231 <0.001 BMI(kg/m2) 20.16(18.99~21.88) 22.97(21.58~23.29) 24.82(23.65~26.00) 27.12(25.71~28.69) H=788.328 <0.001 TyG-WC 563.7(529.0~609.8) 664.2(613.9~721.5) 790.2(747.7~831.7) 896.1(822.8~935.6) H=854.144 <0.001 注:AST,天冬氨酸氨基转移酶;ALT,丙氨酸氨基转移酶;TC,总胆固醇;TG,甘油三酯;HDL-C,高密度脂蛋白胆固醇;LDL-C,低密度脂蛋白胆固醇;BMI,体重指数;TyG,甘油三酯葡萄糖指数;WC,腰围;TyG-WC,甘油三酯葡萄糖-腰围指数;TyG-BMI,甘油三酯葡萄糖-体重指数。
下载: 导出CSV
表 3 不同TyG-BMI轨迹组发生MAFLD的单因素Cox分析
Table 3. Univariate Cox analysis of the incidence of MAFLD in different TyG-BMI trajectory groups
因素 β值 SE Wald HR(95%CI) P值 TyG-BMI分组 中水平组 1.826 0.255 51.069 6.208(3.762~10.243) <0.001 高水平组 2.539 0.253 100.639 12.661(7.710~20.790) <0.001 极高水平组 2.849 0.258 122.168 17.277(10.424~28.635) <0.001 男性 0.910 0.102 79.349 2.484(2.033~3.034) <0.001 年龄(岁) 0.019 0.004 20.581 1.019(1.011~1.028) <0.001 白细胞计数(×109/L) 0.133 0.024 30.018 1.142(1.089~1.198) <0.001 红细胞计数(×1012/L) 0.586 0.073 64.202 1.797(1.557~2.074) <0.001 血红蛋白(g/L) 0.010 0.001 69.799 1.010(1.008~1.013) <0.001 肌酐(μmol/L) 0.083 0.031 7.070 1.087(1.022~1.156) 0.008 尿素(mmol/L) 0.013 0.002 42.480 1.013(1.009~1.017) <0.001 尿酸(μmol/L) 0.005 0.000 119.697 1.005(1.004~1.005) <0.001 空腹血糖(mmol/L) 0.110 0.021 28.620 1.116(1.072~1.162) <0.001 AST(U/L) 0.023 0.004 26.268 1.023(1.014~1.032) <0.001 ALT(U/L) 0.017 0.002 118.064 1.018(1.014~1.021) <0.001 收缩压(mmHg) 0.018 0.003 48.849 1.018(1.013~1.023) <0.001 舒张压(mmHg) 0.033 0.004 78.123 1.033(1.026~1.041) <0.001 BMI(kg/m2) 0.199 0.013 225.807 1.220(1.189~1.253) <0.001 TG(mmol/L) 0.104 0.011 85.896 1.110(1.085~1.134) <0.001 TC(mmol/L) 0.117 0.036 10.746 1.125(1.048~1.206) 0.001 HDL-C(mmol/L) -1.804 0.160 127.203 0.165(0.120~0.225) <0.001 LDL-C(mmol/L) 0.288 0.053 29.990 1.334(1.203~1.479) <0.001 TyG 0.754 0.057 177.230 2.125(1.901~2.374) <0.001 WC(cm) 0.005 0.001 39.463 1.005(1.003~1.007) <0.001 TyG-WC 0.001 0.000 79.260 1.001(1.000~1.001) <0.001 注:AST,天冬氨酸氨基转移酶;ALT,丙氨酸氨基转移酶;TC,总胆固醇;TG,甘油三酯;HDL-C,高密度脂蛋白胆固醇;LDL-C,低密度脂蛋白胆固醇;BMI,体重指数;TyG,甘油三酯葡萄糖指数;WC,腰围;TyG-WC,甘油三酯葡萄糖-腰围指数;TyG-BMI,甘油三酯葡萄糖-体重指数;MAFLD,代谢相关脂肪性肝病;HR,风险比;CI,置信区间;SE,标准误。
下载: 导出CSV
表 4 不同TyG-BMI轨迹组发生MAFLD的多因素Cox分析
Table 4. Multivariate Cox analysis of the incidence of MAFLD in different TyG-BMI trajectory groups
因素 β值 SE Wald HR(95%CI) P值 TyG-BMI分组 中水平组 1.488 0.260 32.710 4.430(2.660~7.377) <0.001 高水平组 1.937 0.267 52.608 6.937(4.110~11.708) <0.001 极高水平组 2.078 0.280 55.132 7.989(4.616~13.827) <0.001 尿酸(μmol/L) 0.001 0.001 4.248 1.001(1.000~1.002) 0.039 HLD-C(mmol/L) -0.659 0.181 13.256 0.517(0.363~0.738) <0.001 舒张压(mmHg) 0.009 0.004 4.371 1.009(1.001~1.017) 0.037 血红蛋白(g/L) 0.006 0.002 7.660 1.006(1.002~1.010) 0.006 ALT(U/L) 0.006 0.002 8.067 1.006(1.002~1.011) 0.005 注:ALT,丙氨酸氨基转移酶;HDL-C,高密度脂蛋白胆固醇;TyG-BMI,甘油三酯葡萄糖-体重指数;MAFLD,代谢相关脂肪性肝病;HR,风险比;CI,置信区间;SE,标准误。
下载: 导出CSV
表 5 TyG-BMI及其相关参数对MAFLD的诊断效能比较
Table 5. Comparison of the diagnostic efficacy of the TyG-BMI and its related parameters for MAFLD
指标 AUC(95%CI) 最佳临
界值敏感
度特异
度P值 WC 0.769(0.743~0.795) 87.500 0.616 0.804 <0.001 BMI 0.811(0.788~0.834) 23.850 0.693 0.763 <0.001 TyG 0.780(0.756~0.805) 8.505 0.836 0.595 <0.001 TyG-WC 0.824(0.801~0.847) 758.835 0.697 0.805 <0.001 TyG-BMI 0.859(0.840~0.879) 209.220 0.798 0.763 <0.001 注:WC,腰围;BMI,体重指数;TyG,甘油三酯葡萄糖指数;TyG-BMI,甘油三酯葡萄糖-体重指数;AUC,曲线下面积;CI,置信区间;MAFLD,代谢相关脂肪性肝病。
下载: 导出CSV
-
[1] GUO XY, YIN XZ, LIU ZJ, et al. Non-alcoholic fatty liver disease(NAFLD) pathogenesis and natural products for prevention and treatment[J]. Int J Mol Sci, 2022, 23( 24): 15489. DOI: 10.3390/ijms232415489. [2] HUANG WS. The prevalence of metabolic dysfunction-associated fatty liver disease in Asia[J]. J Clin Hepatol, 2025, 41( 9): 1721- 1724. DOI: 10.12449/JCH250901.黄炜燊. 亚洲地区代谢相关脂肪性肝病流行情况[J]. 临床肝胆病杂志, 2025, 41( 9): 1721- 1724. DOI: 10.12449/JCH250901. [3] ESLAM M, SANYAL AJ, GEORGE J. MAFLD: A consensus-driven proposed nomenclature for metabolic associated fatty liver disease[J]. Gastroenterology, 2020, 158( 7): 1999- 2014. DOI: 10.1053/j.gastro.2019.11.312. [4] ESLAM M, FAN JG, YU ML, et al. The Asian Pacific Association for the Study of the Liver clinical practice guidelines for the diagnosis and management of metabolic dysfunction-associated fatty liver disease[J]. Hepatol Int, 2025, 19( 2): 261- 301. DOI: 10.1007/s12072-024-10774-3. [5] TANASE DM, GOSAV EM, COSTEA CF, et al. The intricate relationship between type 2 diabetes mellitus(T2DM), insulin resistance(IR), and nonalcoholic fatty liver disease(NAFLD)[J]. J Diabetes Res, 2020, 2020: 3920196. DOI: 10.1155/2020/3920196. [6] YANG B, ZHANG R. Progress on the treatment of metabolic associated fatty liver disease[J/OL]. Chin J Liver Dis(Electronic Version), 2024, 16( 4): 25- 30. DOI: 10.3969/j.issn.1674-7380.2024.04.004.杨彬, 张瑞. 代谢相关脂肪性肝病治疗进展[J/OL]. 中国肝脏病杂志(电子版), 2024, 16( 4): 25- 30. DOI: 10.3969/j.issn.1674-7380.2024.04.004. [7] FERGUSON D, FINCK BN. Emerging therapeutic approaches for the treatment of NAFLD and type 2 diabetes mellitus[J]. Nat Rev Endocrinol, 2021, 17( 8): 484- 495. DOI: 10.1038/s41574-021-00507-z. [8] XUE Y, XU JH, LI M, et al. Potential screening indicators for early diagnosis of NAFLD/MAFLD and liver fibrosis: Triglyceride glucose index-related parameters[J]. Front Endocrinol, 2022, 13: 951689. DOI: 10.3389/fendo.2022.951689. [9] MIN Y, WEI XY, WEI ZG, et al. Prognostic effect of triglyceride glucose-related parameters on all-cause and cardiovascular mortality in the United States adults with metabolic dysfunction-associated steatotic liver disease[J]. Cardiovasc Diabetol, 2024, 23( 1): 188. DOI: 10.1186/s12933-024-02287-y. [10] Chinese Society of Hepatology, Chinese Medical Association. Guidelines for the prevention and treatment of metabolic dysfunction-associated(non-alcoholic) fatty liver disease(version 2024)[J]. J Pract Hepatol, 2024, 27( 4): 494- 510. DOI: 10.3760/cma.j.cn501113-20240327-00163.中华医学会肝病学分会. 代谢相关(非酒精性)脂肪性肝病防治指南(2024年版)[J]. 实用肝脏病杂志, 2024, 27( 4): 494- 510. DOI: 10.3760/cma.j.cn501113-20240327-00163. [11] LEI RY, XUE BD, TIAN XY, et al. The association between endocrine disrupting chemicals and MAFLD: Evidence from NHANES survey[J]. Ecotoxicol Environ Saf, 2023, 256: 114836. DOI: 10.1016/j.ecoenv.2023.114836. [12] CHEN N, GENG N, LI J. Mechanisms and clinical practice advances in weight reduction for patients with metabolic associated fatty liver disease[J/OL]. Chin J Liver Dis(Electronic Version), 2025, 17( 3): 10- 16. DOI: 10.3969/j.issn.1674-7380.2025.03.002.陈楠, 耿楠, 李婕. 代谢相关脂肪性肝病患者减重治疗机制与临床实践进展[J/OL]. 中国肝脏病杂志(电子版), 2025, 17( 3): 10- 16. DOI: 10.3969/j.issn.1674-7380.2025.03.002. [13] PETTA S, DI MARCO V, PIPITONE RM, et al. Prevalence and severity of nonalcoholic fatty liver disease by transient elastography: Genetic and metabolic risk factors in a general population[J]. Liver Int, 2018, 38( 11): 2060- 2068. DOI: 10.1111/liv.13743. [14] RUBINO F, CUMMINGS DE, ECKEL RH, et al. Definition and diagnostic criteria of clinical obesity[J]. Lancet Diabetes Endocrinol, 2025, 13( 3): 221- 262. DOI: 10.1016/S2213-8587(24)00316-4. [15] ER LK, WU S, CHOU HH, et al. Triglyceride glucose-body mass index is a simple and clinically useful surrogate marker for insulin resistance in nondiabetic individuals[J]. PLoS One, 2016, 11( 3): e0149731. DOI: 10.1371/journal.pone.0149731. [16] TAO LC, XU JN, WANG TT, et al. Triglyceride-glucose index as a marker in cardiovascular diseases: Landscape and limitations[J]. Cardiovasc Diabetol, 2022, 21( 1): 68. DOI: 10.1186/s12933-022-01511-x. [17] ZHOU JH, ZHOU F, WANG WX, et al. Epidemiological features of NAFLD from 1999 to 2018 in China[J]. Hepatology, 2020, 71( 5): 1851- 1864. DOI: 10.1002/hep.31150. [18] QIN Q, ZHANG T, YAN S, et al. The reliation between trajectory of triglyceride glucose index combined with body mass index and new-onset non-alcoholic fatty liver disease[J]. Chin Health Manag, 2023, 17( 12): 909- 915. DOI: 10.3760/cma.j.cn115624-20230720-00020.秦迁, 张滔, 闫肃, 等. 甘油三酯葡萄糖指数联合体重指数的轨迹与新发非酒精性脂肪性肝病的相关性[J]. 中华健康管理学杂志, 2023, 17( 12): 909- 915. DOI: 10.3760/cma.j.cn115624-20230720-00020. [19] TONG C, LI Q, KONG L, et al. Sex-specific metabolic risk factors and their trajectories towards the non-alcoholic fatty liver disease incidence[J]. J Endocrinol Invest, 2022, 45( 12): 2233- 2245. DOI: 10.1007/s40618-022-01848-w. [20] CHEN Q, YANG LY, ZHANG JX, et al. Correlation of non-alcoholic fatty liver with blood lipids and blood routine indicators[J]. Int Med Health Guid News, 2019, 25( 11): 1810- 1813. DOI: 10.3760/cma.j.issn.1007-1245.2019.11.040.陈群, 杨柳茵, 张建兴, 等. 非酒精性脂肪肝与血脂及血常规指标的相关性[J]. 国际医药卫生导报, 2019, 25( 11): 1810- 1813. DOI: 10.3760/cma.j.issn.1007-1245.2019.11.040. [21] WANG S, ZHANG J, ZHANG J, et al. A cohort study on the correlation between body mass index trajectories and new-onset non-alcoholic fatty liver disease[J]. Chin J Hepatol, 2020, 28( 7): 597- 602. DOI: 10.3760/cma.j.cn501113-20190629-00230.王珊, 张健, 张杰, 等. 体质量指数轨迹与新发非酒精性脂肪性肝病相关性的队列研究[J]. 中华肝脏病杂志, 2020, 28( 7): 597- 602. DOI: 10.3760/cma.j.cn501113-20190629-00230. [22] WANG LN, GAO PF, CAO F, et al. Analysis of the prevalence and influencing factors of non-alcoholic fatty liver disease in different gender groups[J]. Chin Gen Pract, 2023, 26( 33): 4143- 4151. DOI: 10.12114/j.issn.1007-9572.2023.0107.王丽娜, 高鹏飞, 曹帆, 等. 不同性别人群非酒精性脂肪性肝病患病现况及影响因素分析[J]. 中国全科医学, 2023, 26( 33): 4143- 4151. DOI: 10.12114/j.issn.1007-9572.2023.0107. [23] LI YW, SHAN LL, WEN Q, et al. Triglyceride glucose-waist circumference as a useful predictor for diabetes mellitus: A secondary retrospective analysis utilizing a Japanese cohort study[J]. BMC Endocr Disord, 2025, 25( 1): 17. DOI: 10.1186/s12902-025-01834-2. [24] JIANG CY, YANG RJ, KUANG MB, et al. Triglyceride glucose-body mass index in identifying high-risk groups of pre-diabetes[J]. Lipds Health Dis, 2021, 20( 1): 161. DOI: 10.1186/s12944-021-01594-7. [25] SHENG GT, LU S, XIE QY, et al. The usefulness of obesity and lipid-related indices to predict the presence of non-alcoholic fatty liver disease[J]. Lipids Health Dis, 2021, 20( 1): 134. DOI: 10.1186/s12944-021-01561-2. [26] ZHANG Q, LIU ZL, ZHANG JQ, et al. Association between TyG related parameters and metabolic dysfunction associated fatty liver disease among nondiabetic individuals[J]. Sci Rep, 2025, 15( 1): 4566. DOI: 10.1038/s41598-024-84917-9. [27] HU HF, HAN Y, CAO CC, et al. The triglyceride glucose-body mass index: A non-invasive index that identifies non-alcoholic fatty liver disease in the general Japanese population[J]. J Transl Med, 2022, 20( 1): 398. DOI: 10.1186/s12967-022-03611-4. [28] CHEN QL, HU PP, HOU XX, et al. Association between triglyceride-glucose related indices and mortality among individuals with non-alcoholic fatty liver disease or metabolic dysfunction-associated steatotic liver disease[J]. Cardiovasc Diabetol, 2024, 23( 1): 232. DOI: 10.1186/s12933-024-02343-7. [29] SON DH, LEE HS, LEE YJ, et al. Comparison of triglyceride-glucose index and HOMA-IR for predicting prevalence and incidence of metabolic syndrome[J]. Nutr Metab Cardiovasc Dis, 2022, 32( 3): 596- 604. DOI: 10.1016/j.numecd.2021.11.017. -

 本文二维码
本文二维码
计量
- 文章访问数: 455
- HTML全文浏览量: 1114
- PDF下载量: 108
- 被引次数: 0


