
 PDF下载 ( 1102 KB)

血清肌酐/胱抑素C比值与成人非酒精性脂肪性肝病的关联性分析
DOI: 10.12449/JCH250613
Association between serum creatinine/cystatin C ratio and nonalcoholic fatty liver disease in adults
-
摘要:
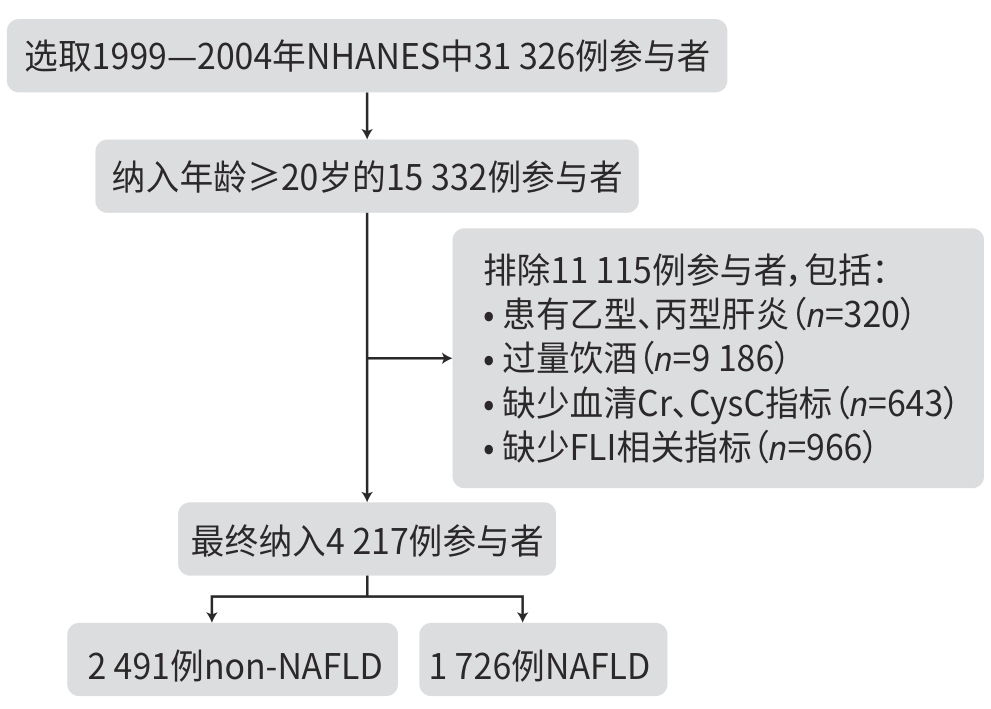
目的 基于美国国家健康与营养检查调查(NHANES)数据库,探讨血清肌酐/胱抑素C比值(CCR)与非酒精性脂肪性肝病(NAFLD)之间的关系,旨在评估CCR作为反映机体代谢状态指标的潜在意义。 方法 本研究数据来源于1999—2004年的NHANES,将纳入人群(n=4 217)分为NAFLD组(n=1 726)和non-NAFLD组(n=2 491),比较2组间CCR的差异,并分析CCR与NAFLD之间的关联性。计量资料2组间比较采用Wilcoxon秩和检验;计数资料2组间比较采用χ2检验。为探讨CCR与NAFLD之间的关系,应用多重调整的Logistic回归模型;将CCR根据四分位数分为4组,以第1个四分位数为参考并计算回归模型中的比值比(OR)和95%置信区间(95%CI)。此外,进行限制性立方样条分析探讨CCR与NAFLD之间的是否存在非线性关系,并在Logistic回归模型中引入交互项进行交互作用分析,同时按变量分层开展亚组分析,以探讨不同人群中CCR与NAFLD关联的差异。 结果 non-NAFLD组CCR水平高于NAFLD组,差异有统计学意义(Z=-4.76,P<0.01)。Logistic回归分析显示,在未调整变量的模型1中,CCR与NAFLD呈负向关联(OR=0.993,95%CI:0.989~0.996,P<0.01),在调整所有变量的模型3中,CCR与NAFLD之间的负向关联依然存在(OR=0.986,95%CI:0.981~0.991,P<0.01)。在按四分位数分析CCR时,在所有模型中均观察到CCR升高与NAFLD风险降低之间的显著关联。在模型3中,与最低四分位数相比,最高四分位数参与者的NAFLD风险显著降低(OR=0.426,95%CI:0.316~0.574,P<0.01)。进一步的交互作用和亚组分析显示,CCR与年龄、性别之间的交互作用具有统计学意义(P交互分别为<0.01、0.04)。在年龄亚组分析中,CCR与NAFLD的关联在中年人群(≤60岁)中更为显著(OR=0.982,95%CI:0.976~0.987);性别亚组分析显示,在女性中CCR与NAFLD的关联更强(OR=0.979,95%CI:0.972~0.986)。 结论 CCR与NAFLD存在显著的负向关联,这种关联在中年人群和女性人群中更为显著。 Abstract:Objective To investigate the association between serum creatinine/cystatin C ratio (CCR) and nonalcoholic fatty liver disease (NAFLD) based on the NHANES database, and to evaluate the potential significance of CCR as an indicator reflecting the metabolic status of the body. Methods Based on the data from the NHANES database in 1999 — 2004, a total of 4 217 participants were enrolled and divided into NAFLD group with 1 726 participants and non-NAFLD group with 2 491 participants. CCR was compared between the two groups, and the association between CCR and NAFLD was analyzed. The Wilcoxon rank-sum test was used for comparison of continuous data between two groups, and the chi-square test was used for comparison of categorical data between two groups. The multivariate logistic regression model was used to investigate the association between CCR and NAFLD; CCR was divided into 4 groups based on quartiles, and odds ratio (OR) and 95% confidence interval (CI) in the regression model was calculated with the first quartile as reference. In addition, the restricted cubic spline analysis was used to investigate whether there was a non-linear relationship between CCR and NAFLD, and interaction items were introduced into the Logistic regression model to perform an interaction analysis. Subgroup analyses were performed based on the stratification of variables to investigate the difference in the association between CCR and NAFLD in different populations. Results The non-NAFLD group had a significantly higher CCR than the NAFLD group (Z=-4.76,P<0.01). The Logistic regression analysis showed that in model 1 without adjustment of variables, CCR was negatively associated with NAFLD (OR=0.993,95%CI:0.989 — 0.996,P<0.01), and in model 3 with adjustment of all variables, CCR was still negatively associated with NAFLD (OR=0.986,95%CI:0.981 — 0.991,P<0.01). The analysis of CCR based on quartiles showed a significant association between the increase in CCR and the reduction in the risk of NAFLD. In model 3, compared with the individuals with the lowest quartile of CCR, the individuals with the highest quartile of CCR had a significantly lower risk of NAFLD (OR=0.426,95%CI:0.316 — 0.574,P<0.01). Further interaction and subgroup analyses showed that the interaction between CCR and age/sex had a statistical significance (Pinteraction<0.01 and Pinteraction=0.04). The subgroup analysis based on age showed a more significant association between CCR and NAFLD in the middle-aged population (≤60 years) (OR=0.982,95%CI:0.976 — 0.987), and the subgroup analysis based on sex showed a stronger association between CCR and NAFLD in women (OR=0.979,95%CI:0.972 — 0.986). Conclusion This study shows a significant negative association between CCR and NAFLD, and such association is more significant in middle-aged individuals and women. -
Key words:
- Non-alcoholic Fatty Liver Disease /
- Creatinine /
- Cystatin C
-
表 1 NAFLD和non-NAFLD组基线特征
Table 1. Baseline characteristics of NAFLD group and non-NAFLD group
变量 总计(n=4 217) non-NAFLD(n=2 491) NAFLD(n=1 726) 统计值 P值 年龄(岁) 48(35~64) 45(32~62) 53(40~66) Z=10.09 <0.01 性别[例(%)] χ2=93.95 <0.01 男 2 163(51.29) 1 123(45.08) 1 040(60.25) 女 2 054(48.71) 1 368(54.92) 686(39.75) 教育程度[例(%)] χ2=38.88 <0.01 <高中 909(21.56) 469(18.83) 440(25.49) 高中 943(22.36) 532(21.36) 411(23.81) ≥大学 2 365(56.08) 1 490(59.82) 875(50.70) 种族[例(%)] χ2=21.80 <0.01 墨西哥裔美国人 766(18.16) 402(16.14) 364(21.09) 非西班牙裔白人 2 523(59.83) 1 542(61.90) 981(56.84) 非西班牙裔黑人 650(15.41) 370(14.85) 280(16.22) 其他种族 278(6.59) 177(7.11) 101(5.85) Pir[例(%)] χ2=1.93 0.38 低 747(17.71) 425(17.06) 322(18.66) 中等 1 536(36.42) 909(36.49) 627(36.33) 高 1 934(45.86) 1 157(46.45) 777(45.02) BMI(kg/m2) 27.16(24.00~30.98) 24.63(22.46~26.89) 31.63(29.02~35.41) Z=61.20 <0.01 WC(cm) 96.1(86.3~106.1) 88.2(81.0~94.9) 108.3(102.0~115.4) Z=67.30 <0.01 高血压[例(%)] χ2=16.82 <0.01 否 2 606(61.80) 1 603(64.35) 1 003(58.11) 是 1 611(38.20) 888(35.65) 723(41.89) 糖尿病[例(%)] χ2=189.55 <0.01 否 3 798(90.06) 2 375(95.34) 1 423(82.44) 是 419(9.94) 116(4.66) 303(17.56) 抽烟状况[例(%)] χ2=71.39 <0.01 从不抽烟 2 151(51.01) 1 373 (55.12) 778(45.08) 以前抽烟 1 289(30.57) 638 (25.61) 651(37.72) 当前抽烟 777(18.43) 480 (19.27) 297(17.21) CCR 95.67(80.36~112.47) 97.95(82.64~114.66) 92.69(77.54~109.50) Z=-4.76 <0.01 GGT(U/L) 20(15~32) 17(13~24) 28(19~43) Z=28.61 <0.01 TG(mg/dL) 112(77~165) 89(65~125) 155(113~229) Z=33.88 <0.01 TC(mg/dL) 202(177~229) 197(172~224) 209(184~236) Z=9.53 <0.01 HDL-C(mg/dL) 51(42~62) 56(46~68) 44(38~53) Z=-23.55 <0.01  下载: 导出CSV
表 2 CCR 与 NAFLD 的逻辑回归分析
Table 2. Logistic regression analysis of CCR and NAFLD
变量 模型1 模型2 模型3 OR(95%CI) P值 OR(95%CI) P值 OR(95%CI) P值 CCR 0.993(0.989~0.996) <0.01 0.984(0.980~0.988) <0.01 0.986(0.981~0.991) <0.01 CCR分类 Q1 1.000 1.000 1.000 Q2 0.854(0.690~1.058) 0.15 0.690(0.547~0.871) <0.01 0.682(0.526~0.885) <0.01 Q3 0.612(0.494~0.758) <0.01 0.417(0.328~0.530) <0.01 0.449(0.345~0.585) <0.01 Q4 0.658(0.531~0.815) <0.01 0.376(0.289~0.489) <0.01 0.426(0.316~0.574) <0.01 注:在模型1中未调整变量;在模型2中调整年龄、性别、种族、教育、收入贫困比等人口学变量;模型3在模型2的基础上调整了TC、HDL-C、高血压、糖尿病、抽烟状况等协变量。
下载: 导出CSV
表 3 CCR与NAFLD的亚组分析和交互作用分析
Table 3. Subgroup analysis and interaction of CCR and NAFLD
变量 OR(95%CI) P交互 年龄 <0.01 ≤60岁 0.982(0.976~0.987) >60岁 0.995(0.989~1.001) 性别 0.04 男性 0.992(0.986~0.998) 女性 0.979(0.972~0.986) 教育程度 0.62 <高中 0.984(0.972~0.996) 高中 0.987(0.975~0.998) ≥大学 0.986(0.980~0.992) 种族 0.16 非西班牙裔白人 0.987(0.981~0.992) 其他种族 0.982(0.967~0.997) Pir 0.27 低 0.986(0.975~0.997) 中等 0.984(0.977~0.992) 高 0.986(0.979~0.993) 高血压 0.64 否 0.989(0.983~0.994) 是 0.980(0.972~0.989) 糖尿病 0.72 否 0.986(0.981~0.991) 是 0.987(0.972~1.003) 抽烟状况 0.49 从不抽烟 0.987(0.980~0.994) 既往抽烟 0.984(0.976~0.992) 当前抽烟 0.987(0.976~0.999) TC 0.34 ≤200 mg/dL 0.984(0.977~0.990) >200 mg/dL 0.989(0.982~0.996) HDL-C 0.53 ≤45 mg/dL 0.989(0.982~0.995) >45 mg/dL 0.982(0.976~0.989)
下载: 导出CSV
表 4 CCR与NAFLD 的Logistic回归分析
Table 4. Logistic regression analysis of CCR and NAFLD
变量 模型1 模型2 模型3 OR(95%CI) P值 OR(95%CI) P值 OR(95%CI) P值 CCR 0.989(0.984~0.995) <0.01 0.976(0.969~0.984) <0.01 0.981(0.973~0.990) <0.01 CCR分类 Q1 1.000 1.000 1.000 Q2 0.590(0.421~0.825) <0.01 0.447(0.306~0.654) <0.01 0.537(0.347~0.832) <0.01 Q3 0.545(0.391~0.761) <0.01 0.321(0.215~0.479) <0.01 0.410(0.263~0.640) <0.01 Q4 0.545(0.390~0.761) <0.01 0.248(0.160~0.386) <0.01 0.350(0.210~0.583) <0.01 注:在模型1中未调整变量;在模型2中调整年龄、性别、种族、教育、收入贫困比等人口学变量;模型3在模型2的基础上调整了TC、HDL-C、高血压、糖尿病、抽烟状况等协变量。
下载: 导出CSV
表 5 CCR与NAFLD的亚组分析和交互作用
Table 5. Subgroup analysis and interaction of CCR and NAFLD
变量 OR(95%CI) P交互 年龄 <0.01 ≤60岁 0.973(0.963~0.984) >60岁 1.000(0.986~1.014) 性别 0.02 男 0.990(0.980~0.999) 女 0.968(0.958~0.979)
下载: 导出CSV
-
[1] FRIEDMAN SL, NEUSCHWANDER-TETRI BA, RINELLA M, et al. Mechanisms of NAFLD development and therapeutic strategies[J]. Nat Med, 2018, 24( 7): 908- 922. DOI: 10.1038/s41591-018-0104-9. [2] TANASE DM, GOSAV EM, COSTEA CF, et al. The intricate relationship between type 2 diabetes mellitus(T2DM), insulin resistance(IR), and nonalcoholic fatty liver disease(NAFLD)[J]. J Diabetes Res, 2020, 2020: 3920196. DOI: 10.1155/2020/3920196. [3] POUWELS S, SAKRAN N, GRAHAM Y, et al. Non-alcoholic fatty liver disease(NAFLD): A review of pathophysiology, clinical management and effects of weight loss[J]. BMC Endocr Disord, 2022, 22( 1): 63. DOI: 10.1186/s12902-022-00980-1. [4] GAITONDE DY, COOK DL, RIVERA IM. Chronic kidney disease: Detection and evaluation[J]. Am Fam Physician, 2017, 96( 12): 776- 783. [5] BENOIT SW, CICCIA EA, DEVARAJAN P. Cystatin C as a biomarker of chronic kidney disease: Latest developments[J]. Expert Rev Mol Diagn, 2020, 20( 10): 1019- 1026. DOI: 10.1080/14737159.2020.1768849. [6] NIU YX, ZHANG WW, ZHANG HM, et al. Serum creatinine levels and risk of nonalcohol fatty liver disease in a middle-aged and older Chinese population: A cross-sectional analysis[J]. Diabetes Metab Res Rev, 2022, 38( 2): e3489. DOI: 10.1002/dmrr.3489. [7] HWANG JA, SONG Y, SHIN J, et al. Changes in mortality according to creatinine/cystatin C ratio in chronic kidney disease and non-chronic kidney disease patients[J]. Front Med(Lausanne), 2022, 9: 810901. DOI: 10.3389/fmed.2022.810901. [8] SHI JL, WU YF, ZHU SY, et al. The association between serum creatinine/cystatin C ratio and cardiovascular morbidity and mortality: Insights from NHANES[J]. Rev Cardiovasc Med, 2023, 24( 9): 275. DOI: 10.31083/j.rcm2409275. [9] BEDOGNI G, BELLENTANI S, MIGLIOLI L, et al. The Fatty Liver Index: A simple and accurate predictor of hepatic steatosis in the general population[J]. BMC Gastroenterol, 2006, 6( 1): 33. DOI: 10.1186/1471-230X-6-33. [10] GOLABI P, GERBER L, PAIK JM, et al. Contribution of sarcopenia and physical inactivity to mortality in people with non-alcoholic fatty liver disease[J]. JHEP Rep, 2020, 2( 6): 100171. DOI: 10.1016/j.jhepr.2020.100171. [11] LIU CF, CHIEN LW. Predictive role of neutrophil-percentage-to-albumin ratio(NPAR) in nonalcoholic fatty liver disease and advanced liver fibrosis in nondiabetic US adults: Evidence from NHANES 2017-2018[J]. Nutrients, 2023, 15( 8): 1892. DOI: 10.3390/nu15081892. [12] OSAKA T, HAMAGUCHI M, HASHIMOTO Y, et al. Decreased the creatinine to cystatin C ratio is a surrogate marker of sarcopenia in patients with type 2 diabetes[J]. Diabetes Res Clin Pract, 2018, 139: 52- 58. DOI: 10.1016/j.diabres.2018.02.025. [13] LI SB, LU J, GU G, et al. Serum creatinine-to-cystatin C ratio in the progression monitoring of non-alcoholic fatty liver disease[J]. Front Physiol, 2021, 12: 664100. DOI: 10.3389/fphys.2021.664100. [14] KITAGO M, SEINO S, SHINKAI S, et al. Cross-sectional and longitudinal associations of creatinine-to-cystatin C ratio with sarcopenia parameters in older adults[J]. J Nutr Health Aging, 2023, 27( 11): 946- 952. DOI: 10.1007/s12603-023-2029-3. [15] TABARA Y, KOHARA K, OKADA Y, et al. Creatinine-to-cystatin C ratio as a marker of skeletal muscle mass in older adults: J-SHIPP study[J]. Clin Nutr, 2020, 39( 6): 1857- 1862. DOI: 10.1016/j.clnu.2019.07.027. [16] MIKAMI K, ENDO T, SAWADA N, et al. Association of serum creatinine-to-cystatin C ratio with skeletal muscle mass and strength in nonalcoholic fatty liver disease in the Iwaki Health Promotion Project[J]. J Clin Biochem Nutr, 2022, 70( 3): 273- 282. DOI: 10.3164/jcbn.21-61. [17] CHUNG GE, KIM MJ, YIM JY, et al. Sarcopenia is significantly associated with presence and severity of nonalcoholic fatty liver disease[J]. J Obes Metab Syndr, 2019, 28( 2): 129- 138. DOI: 10.7570/jomes.2019.28.2.129. [18] LUO YF, LIN H. Inflammation initiates a vicious cycle between obesity and nonalcoholic fatty liver disease[J]. Immun Inflamm Dis, 2021, 9( 1): 59- 73. DOI: 10.1002/iid3.391. [19] UTZSCHNEIDER KM, KAHN SE. The role of insulin resistance in nonalcoholic fatty liver disease[J]. J Clin Endocrinol Metab, 2006, 91( 12): 4753- 4761. DOI: 10.1210/jc.2006-0587. [20] LIU ZJ, ZHU CF. Causal relationship between insulin resistance and sarcopenia[J]. Diabetol Metab Syndr, 2023, 15( 1): 46. DOI: 10.1186/s13098-023-01022-z. [21] CAPEL F, PINEL A, WALRAND S. Accumulation of intramuscular toxic lipids, a link between fat mass accumulation and sarcopenia[J]. Ocl, 2019, 26: 24. DOI: 10.1051/ocl/2019023. [22] FRANK AP, de SOUZA SANTOS R, PALMER BF, et al. Determinants of body fat distribution in humans may provide insight about obesity-related health risks[J]. J Lipid Res, 2019, 60( 10): 1710- 1719. DOI: 10.1194/jlr.R086975. [23] de PAOLI M, ZAKHARIA A, WERSTUCK GH. The role of estrogen in insulin resistance: A review of clinical and preclinical data[J]. Am J Pathol, 2021, 191( 9): 1490- 1498. DOI: 10.1016/j.ajpath.2021.05.011. [24] GERACI A, CALVANI R, FERRI E, et al. Sarcopenia and menopause: The role of estradiol[J]. Front Endocrinol(Lausanne), 2021, 12: 682012. DOI: 10.3389/fendo.2021.682012. [25] JEONG HG, PARK H. Metabolic disorders in menopause[J]. Metabolites, 2022, 12( 10): 954. DOI: 10.3390/metabo12100954. [26] DAM TV, DALGAARD LB, RINGGAARD S, et al. Transdermal estrogen therapy improves gains in skeletal muscle mass after 12 weeks of resistance training in early postmenopausal women[J]. Front Physiol, 2021, 11: 596130. DOI: 10.3389/fphys.2020.596130. -


 本文二维码
本文二维码
计量
- 文章访问数: 1087
- HTML全文浏览量: 313
- PDF下载量: 112
- 被引次数: 0

